


Исследование методом плантографии опорной функции стопы у детей с пороками развития ее переднего отдела
- Авторы: Никитюк И.Е.1, Коваленко-Клычкова Н.А.1
-
Учреждения:
- ФГБУ «НИДОИ им. Г.И. Турнера» Минздрава России
- Выпуск: Том 4, № 4 (2016)
- Страницы: 77-83
- Раздел: Статьи
- Статья получена: 10.01.2017
- Статья одобрена: 10.01.2017
- Статья опубликована: 14.12.2016
- URL: https://journals.eco-vector.com/turner/article/view/5899
- DOI: https://doi.org/10.17816/PTORS4477-83
- ID: 5899

Цитировать

Аннотация
Полный текст
Введение
Пороки развития переднего отдела стопы — одна из наиболее сложных проблем детской ортопедии [1, 2]. Происходящие изменения в стопе затрагивают не только форму ее переднего отдела, но и нарушают ее опорную функцию [3]. Очень важна точная оценка функциональных параметров пораженной стопы и в первую очередь ее опороспособности. Данные о корреляции опорной функции стопы с ее геометрическими особенностями актуальны для обеспечения выбора оперативного лечения, проектирования и изготовления корригирующих приспособлений и изделий. Решение этой задачи усложняет колоссальная вариативность формы нормальной стопы, тем более пораженной. Поэтому сохраняет актуальность определение индивидуально-типологической изменчивости морфологии и функции как патологической, так и интактной стопы. В настоящее время для диагностики состояния стоп успешно используется метод компьютерной плантографии [4], который учитывает статические и кинетостатические деформации стопы в положении стоя. Компьютерная плантография дает объективное представление о тяжести деформации, она не только позволяет отразить нарушение формы нагрузочного контура стопы, но и показывает распределение нагрузки на различные ее отделы.
Несмотря на многообразие плантографических способов объективной оценки состояния стопы при различных патологиях, единый универсальный метод не разработан. Поэтому исследование анатомо-функционального состояния стоп с пороками развития переднего отдела у детей с использованием методики плантографии является актуальной задачей, решение которой имеет существенное теоретическое и практическое значение. Эти обстоятельства послужили причиной выполнения настоящего исследования.
Цель исследования — изучение морфофункциональных параметров стоп у детей с пороками развития переднего отдела для оценки дисбаланса нагрузок и выявления структурных и функциональных нарушений.
Материал и методы
Исследование опорной функции стоп проводили на программно-аппаратном комплексе диагностики «Подоскан» (МБН, Россия). Это позволило оценить морфофункциональные параметры стоп у детей с аномалиями развития переднего отдела. Плантографические характеристики были определены у 92 детей в возрасте от 5 до 16 лет, из них контрольную группу составили 28 здоровых детей (56 стоп). В группе детей с пороком развития переднего отдела стопы (64 ребенка) у 30 пациентов были поражены обе стопы, у 34 — только одна стопа: в 20 случаях — справа, в 14 — слева. Таким образом, было обследовано 94 стопы с различной локализацией поражения переднего отдела: 36 — во внутренней области, 40 — в срединной и 18 — в наружной.
Для совершенствования метода компьютерного плантографического анализа стоп с аномалиями развития переднего отдела были использованы существующие методики расчета плантографических характеристик [5, 6], которые были модифицированы в применении к изучаемой патологии.
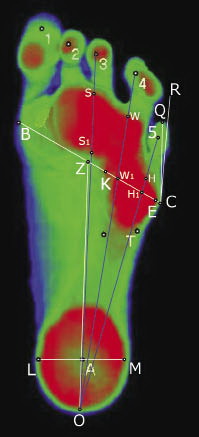
Сначала проводили расчеты по плантограммам здоровых детей, для чего на отпечатках стоп расставляли идентификационные точки и соединяли их линиями (рис. 1), по которым измеряли угловые и линейные характеристики стоп, а также рассчитывали плантографические индексы и коэффициенты в норме.
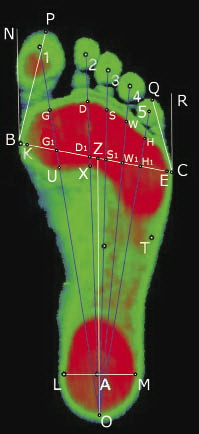
Обработку сканированного отпечатка стопы проводили по следующему алгоритму. На плантограмме выставляли реперные точки, которые соединяли линиями:
- О — крайняя задняя точка отпечатка пятки стопы;
- Р — крайняя передняя точка контура I пальца стопы;
- Q — крайняя передняя точка контура V пальца стопы;
- BC — линия поперечного свода стопы, соединяющая точки B и C;
- B — наиболее выступающая кнутри точка контура переднего отдела стопы;
- C — наиболее выступающая кнаружи точка контура переднего отдела стопы;
- K — точка пересечения линии поперечного свода стопы BC с наиболее выступающей кнутри точкой нагружаемого отпечатка переднего отдела стопы (соответствует головке I плюсневой кости);
- E — точка пересечения линии поперечного свода стопы BC с наиболее выступающей кнаружи точкой нагружаемого отпечатка переднего отдела стопы (соответствует головке I плюсневой кости);
- KЕ — линия нагружаемого поперечного свода стопы, соединяющая точки К и Е;
- Z — середина линии поперечного свода стопы BC;
- OZ — условная ось стопы;
- BN и CR — линии, выходящие из точек B и C параллельно условной оси стопы OZ;
- BP и CQ — линии, выходящие из точек B и C, проходящие через крайние передние точки контура I пальца (P) и V пальца (Q) стопы;
- NBP и QCR — угол соответственно I и V пальцев;
- ОG, ОD, ОS, ОW, ОH — линии Дюкенджиева — 1, 2, 3, 4 и 5 (силовые лучи направления нагрузки соответственно I, II, III, IV и V пальцам);
- G, D, S, W и H — точки пересечения соответствующих линий Дюкенджиева — 1, 2, 3, 4 и 5 с передним краем отпечатка переднего отдела стопы;
- G1, D1, S1, W1 и H1 — точки пересечения соответствующих линий Дюкенджиева — 1, 2, 3, 4 и 5 с линией поперечного свода стопы BC;
- U — точка пересечения линии Дюкенджиева-1 с задней контурной линией отпечатка переднемедиального отдела стопы;
- Х — точка пересечения линии Дюкенджиева-2 с задней контурной линией отпечатка срединного отдела стопы;
- A — центр отпечатка пятки;
- LM — линия, пересекающая центр A и края отпечатка пятки в наиболее широком месте — в точках L и M.
Были рассчитаны плантографические индексы, которые использовали для характеристики отпечатков стоп как в норме, так и при всех пороках их переднего отдела:
- KE/BC — индекс нагружаемости переднего отдела — отражает полноту нагрузки на передний отдел;
- LM/KE — индекс Чипаукс — Смирак — показывает распределение нагрузки между передним и задним отделами стопы.
Кроме того, для характеристики стоп, объединенных в группы по локализации поражения в переднем отделе, были рассчитаны дополнительные индексы и коэффициенты:
- — для порока внутренней области переднего отдела стопы:
- GU/GO — индекс опоры I луча — отражает опороспособность головки I плюсневой кости;
- k1 = GG1 : 1/5OZ — коэффициент дистальной опоры I луча — для выявления смещения переднего контура пятна опоры I плюсневой кости;
- — для порока срединной области переднего отдела стопы:
- DX/DO — индекс опоры срединного отдела — отражает опороспособность головок II–III плюсневых костей;
- k2 = DD1 : 1/5OZ — коэффициент дистальной опоры II луча — для выявления смещения переднего контура пятна опоры II плюсневой кости;
- k3 = SS1 : 1/5OZ — коэффициент дистальной опоры III луча — для выявления смещения переднего контура пятна опоры III плюсневой кости;
- k4 =WW1 : 1/5OZ — коэффициент дистальной опоры IV луча — для выявления смещения переднего контура пятна опоры IV плюсневой кости;
- k2-3-4 = 1/3 × (K2 + K3 + K4) — средний коэффициент дистальной опоры срединных лучей — для оценки деформации переднего контура пятна опоры срединного отдела стопы;
- — для порока наружной области переднего отдела стопы:
- k5 = НН1 : 1/5OZ — коэффициент дистальной опоры V луча — для выявления смещения переднего контура пятна опоры V плюсневой кости.
Статистический анализ результатов исследований проводили с помощью пакета статистических программ Microsoft Excel, который включал расчет средней арифметической вариационных рядов М, их среднеквадратичного отклонения m и 95 % доверительного интервала. Пороговый уровень статистической значимости принимался при значении критерия р < 0,05.
Результаты
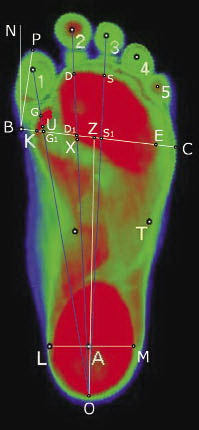
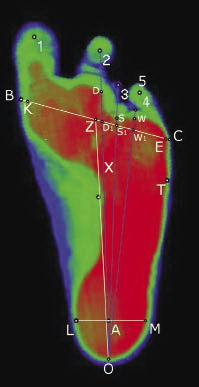
У пациентов с пороками развития переднего отдела стопы в зависимости от локализации поражения плантограммы были распределены на три группы, в каждой из которых были расставлены соответствующие идентификационные точки с последующим соединением их линиями и рассчитаны угловые и линейные характеристики стоп (рис. 2).
Данные плантографических характеристик у детей с пороками развития переднего отдела стопы в зависимости от локализации поражения представлены в табл. 1. Анализ таблицы показал следующее. Средняя величина индекса нагружаемости переднего отдела стопы у здоровых детей составила 94,7 ± 0,39 %. У пациентов с пороками развития переднего отдела стопы среднее значение этого индекса существенно снизилось: до 71,6 ± 1,55 % при локализации патологии во внутренней области, до 74,0 ± 1,57 % — в срединной и до 78,6 ± 2,04 % — в наружной (р < 0,05).
Таблица 1. Сравнительная оценка плантографических характеристик стоп здоровых детей и пациентов с пороками развития переднего отдела стопы в зависимости от локализации поражения (M ± m)
Параметры | Здоровые дети (n = 56) | Пациенты с пороком развития переднего отдела стопы | ||
порок внутренней области (n = 36) | порок срединной области (n = 40) | порок наружной области (n = 18) | ||
Индекс нагружаемости переднего отдела, % | 94,7 ± 0,39 | 71,6 ± 1,55* | 74,0 ± 1,57* | 78,6 ± 2,04* |
Индекс Чипаукс — Смирак | 0,53 ± 0,006 | 0,79 ± 0,024* | 0,75 ± 0,023* | 0,63 ± 0,022* |
Коэффициент дистальной опоры I луча k1 | 0,70 ± 0,01 | 0,27 ± 0,02* | – | – |
Индекс опоры I луча (× 10–2) | 23,3 ± 0,44 | 11,7 ± 1,01* | – | – |
Угол I пальца, ° | 12,0 ± 0,48 | –0,03 ± 1,32* | – | – |
Коэффициент дистальной опоры II луча k2 | 0,99 ± 0,01 | – | 0,78 ± 0,02* | – |
Коэффициент дистальной опоры III луча k3 | 0,97 ± 0,02 | – | 0,65 ± 0,03* | – |
Коэффициент дистальной опоры IV луча k4 | 0,81 ± 0,01 | – | 0,42 ± 0,02* | – |
Средний коэффициент дистальной опоры II, III, IV лучей k2-3-4 | 0,92 ± 0,01 | – | 0,62 ± 0,02* | – |
Индекс опоры срединной области (× 10–2) | 24,5 ± 0,32 | – | 22,4 ± 0,48* | – |
Коэффициент дистальной опоры V луча k5 | 0,54 ± 0,01 | – | – | 0,26 ± 0,04* |
Угол V пальца, ° | 13,4 ± 0,52 | – | – | –2,5 ± 1,62* |
Примечание: символом * обозначены достоверно отличающиеся от нормы показатели с достоверностью не менее р < 0,05.
Таким образом, у пациентов с пороками развития переднего отдела стопы распределение нагрузки в этом отделе было неравномерным, вследствие чего дефицит опорности переднего отдела составил значительную величину: 32, 28 и 20 % соответственно при пороках внутренней, срединной и наружной областей.
Дополнительное привлечение к анализу плантограмм индекса Чипаукс — Смирак позволяет судить о характере смещения нагрузки по отделам стопы. Так, если у здоровых детей отношение нагрузки на задний отдел стопы к нагрузке на передний отдел составляет 0,53 ± 0,006, то у пациентов с пороком переднего отдела стопы индекс Чипаукс-Смирак увеличен до 0,79 ± 0,024 при локализации патологии во внутренней области, 0,75 ± 0,023 — в срединной и 0,63 ± 0,022 — в наружной (р < 0,05).
Таким образом, у пациентов с пороками развития переднего отдела стопы происходит «кальканезация» подошвенной нагрузки, а именно существенное смещение опорности с переднего отдела к заднему — на пяточную кость: с переизбытком 49 % при локализации патологии во внутренней области, 42 % — в срединной и 19 % — в наружной. Наиболее значительное увеличение индекса Чипаукс — Смирак выявлено у пациентов во внутренней и срединной областях. Это свидетельствует о том, что при такой локализации патологии распределение нагрузки в переднем отделе стопы нарушено настолько значительно, что вызывает комбинированное смещение нагрузки как в пределах переднего отдела, так и кзади. Это приводит к длительной неадекватной перегрузке одних и недостаточной нагрузке других отделов стопы, что в обоих случаях является причиной нарушения статодинамической функции стопы.
Использование дополнительных индексов и коэффициентов позволило более подробно оценить нарушение функции стопы в зависимости от локализации патологии в переднем отделе.
Порок развития внутренней области переднего отдела стопы (рис. 2, а). В группе пациентов с указанной патологией индекс опоры I луча оказался сниженным в 2 раза — до (11,7 ± 1,01) × 10–2 по сравнению со здоровыми детьми — (23,3 ± 0,44) × × 10–2 (p < 0,05). Также у пациентов наблюдалось уменьшение в 2,6 раза коэффициента дистальной опоры I луча k1 до 0,27 ± 0,02 по сравнению с этим параметром у здоровых детей: 0,70 ± 0,01 (p < 0,05). В рассматриваемой группе больных был также значительно снижен угол I пальца — до –0,03 ± 1,32° по сравнению с аналогичным показателем в норме: 12,0 ± 0,48° (p < 0,05).
Таким образом, у пациентов с пороками развития переднего отдела стопы с локализацией патологии во внутренней области наблюдается значительное отклонение от нормы плантографических характеристик, что свидетельствует о неравномерности распределения нагрузки по отделам стопы, грубом заднем смещении внутренней точки опоры стопы, дефиците нагрузки на головку I плюсневой кости.
Порок развития срединной области переднего отдела стопы (рис. 2, б). При указанной локализации патологии параметры плантографических характеристик хотя и не были резко отклонены от нормы, однако были статистически достоверно и стабильно снижены. Индекс опоры на срединную область стопы был снижен незначительно: на 9 % — до (22,4 ± 0,48) × 10–2 по сравнению со здоровыми детьми (24,5 ± 0,32) × 10–2 (р < 0,05). Гораздо более показательными оказались стабильно низкие значения коэффициентов дистальной опоры II, III и IV лучей: k2, k3 и k4, величина снижения которых составила соответственно 27, 49 и 93 %. Обращает на себя внимание, что наименьшее отклонение от нормы наблюдается у коэффициента k2, а наибольшие отклонения — у коэффициентов k3 и особенно k4. Это объясняется большой долей пациентов с такой нозологической формой, как брахиметатарзия с укорочением либо одной (чаще IV), либо двух (III и опять же IV) плюсневых костей. Среднее смещение назад переднего контура срединной области стопы характеризуется коэффициентом k2-3-4, который у пациентов был снижен на 48 % по сравнению со здоровыми детьми: соответственно 0,62 ± 0,02 и 0,92 ± 0,01 (р < 0,05).
Таким образом, у пациентов с пороками развития переднего отдела стопы с локализацией патологического процесса в срединной области происходит деформация дистального контура опоры срединной области стопы со значительным смещением назад нагружаемой зоны, особенно в проекции головок III и IV плюсневых костей. При этом наблюдается неравномерность распределения нагрузки по отделам стопы, что свидетельствует о нарушении ее опорной функции.
Порок развития наружной области переднего отдела стопы (рис. 2, в). Анализ дополнительных плантографических характеристик в группе пациентов с указанной патологией показал значительное отклонение от нормы линейных и угловых параметров отпечатков стоп. Величина коэффициента дистальной опоры V луча k5 в этой группе пациентов была значительно снижена: на 108 % до 0,26 ± 0,04 по сравнению с нормальным показателем 0,54 ± 0,01 (p < 0,05). Существенно был уменьшен угол V пальца: до –2,5 ± 1,62° по сравнению с нормальным значением этого угла 13,4 ± 0,52° (p < 0,05).
Таким образом, у пациентов с пороками развития переднего отдела стопы с локализацией патологии в наружной области наблюдается значительное отклонение от нормы плантографических характеристик, что свидетельствует о неравномерности распределения нагрузки по отделам стопы, выраженном заднем смещении наружной точки опоры стопы, латерализации распределения опорности переднего отдела стопы.
Обсуждение
Данные плантографии показали, что у пациентов с пороками развития переднего отдела стопы происходит значительное отклонение от нормы плантографических характеристик от десятков до полутора сотен процентов. Масштабы нарушений параметров патологической стопы целесообразно сопоставить с параметрами физиологических изменений нормальной стопы. Известно, что при вертикальной позе в норме масса тела на передний отдел стопы распределяется следующим образом: на передневнутреннюю область приходится 20,5 % нагрузки и почти столько же на передненаружнюю область — 18,5 % [7]. При ходьбе нагрузка на передний отдел возрастает в несколько большей степени за счет внутренней части — до 36 %, вклад наружной части составляет 26 % [8]. То есть при обычных нагрузках на стопу в норме варьирование нагрузочных параметров в переднем отделе стопы находится в пределах 10–15 %, а при пороке развития переднего отдела стопы величина изменений распределения нагрузки достигает 32 %. Такое нарушение нормальных соотношений нагрузки на различные области стопы приводит не только к нарушению ее функции [9], но и к деформации опорно-двигательного аппарата и нарушению различных функций организма.
Нарушение пропорций длин лучей стопы неизбежно сказывается на ходьбе, для которой существует определенная, жесткая последовательность контакта отделов стопы с опорой. В фазе переката через передний отдел стопы первой вступает в контакт с опорой область головки V плюсневой кости, затем следует область головок II, III, IV плюсневых костей и завершает контакт область головки I плюсневой кости. То есть перекат стопы в переднем отделе происходит во фронтальной плоскости [10], причем это самый динамически нагружаемый процесс наряду с перекатом через пятку. Таким образом, анализ данных плантографии показал, что при пороке развития переднего отдела стопы происходит значительное смещение передних точек опоры стопы в сагиттальной плоскости, что приводит к деформации траектории переката стопы во фронтальной плоскости. Это в свою очередь вызывает нарушение пространственных, временных, кинематических и динамических параметров цикла шага [11].
Выводы
- Предложенная методика анализа отпечатков стоп при пороках развития переднего отдела обладает высокой разрешающей способностью и позволяет уточнить и объективизировать характер нарушений опорной функции стопы в зависимости от локализации поражения.
- Стопа с пороком развития переднего отдела представляет собой единую функциональную единицу, при этом локализация патологического процесса в любой области (внутренней, срединной или наружной) оказывает интегративное влияние на ее функцию опоры, приводящее к нарушению биомеханики не отдельных областей, а всей стопы. Наиболее выраженные отклонения опорной функции стопы выявлены при локализации поражения во внутренней области переднего отдела, менее выраженные — при наружной локализации.
- Характер этих отклонений свидетельствует о нарушении статики стопы (функции опоры) и неполноценности ее динамической функции (нарушение фазы переката через передний отдел стопы при ходьбе), что указывает на целесообразность хирургического восстановления анатомии стопы с целью улучшения ее функции.
Информация о финансировании и конфликте интересов
Работа проведена на базе и при поддержке ФГБУ «НИДОИ им Г.И.Турнера» Минздрава России. Авторы декларируют отсутствие явных и потенциальных конфликтов интересов, связанных с публикацией настоящей статьи.
Об авторах
Игорь Евгеньевич Никитюк
ФГБУ «НИДОИ им. Г.И. Турнера» Минздрава России
Автор, ответственный за переписку.
Email: femtotech@mail.ru
канд. мед. наук, ведущий научный сотрудник лаборатории физиологических и биомеханических исследований Россия
Надежда Александровна Коваленко-Клычкова
ФГБУ «НИДОИ им. Г.И. Турнера» Минздрава России
Email: fake@eco-vector.com
врач отделения патологии стопы, нейроортопедии и системных заболеваний Россия
Список литературы
- Capobianco CM. Surgical treatment approaches to second metatarsophalangeal joint pathology. Clin Podiatr Med Surg. 2012;293:443-9.
- Smolle E, Scheipl S, Leithner A, Radl R. Management of congenital fourth brachymetatarsia by additive autologous lengthening osteotomy (AALO): a case series. Foot Ankle Int. 2015;36(3):325-9. doi: 10.1177/1071100714557520.
- Конюхов М.П., Клычкова И.Ю., Коваленко-Клычкова Н.А., Никитюк И.Е. Пороки развития первого луча стопы у детей: диагностика, клиника, лечение // Ортопедия, травматология и восстановительная хирургия детского возраста. — 2015. — Т. 3. — Вып. 2. — С. 15–24. [Konyukhov MP, Klychkova IY, Kovalenko-Klychkova NA, Nikityuk IE. Malformations of the first ray of the foot in children: diagnosis, clinical picture, treatment. Pediatric traumatology, orthopaedics and reconstructive surgery. 2015;3(2):15-24. (In Russ.)]
- Dzieciol Z, Kuryliszyn-Moskal A, Dzieciol J. Application of plantography examination to the assessment of foot deformity in patients with rheumatoid arthritis. Arch Med Sci. 2015;11(5):1015-1020.
- Перепелкин А.И., Мандриков В.Б., Краюшкин А.И. Влияние дозированной нагрузки на изменение структуры и функции стопы человека: Монография. — Волгоград: Изд-во ВолгГМУ, 2012. — 182 c. [Perepelkin AI, Mandrikov VB, Krayushkin AI. Vliyanie dozirovannoi nagruzki na izmenenie struktury i funktsii stopy cheloveka: Monografiya. Volgograd: Izd-vo VolgGMU; 2012. 182 p. (In Russ.)]
- Никитюк И.Е., Клычкова И.Ю. Компьютерная плантография как метод диагностики врожденной косолапости у детей // Ортопедия, травматология и восстановительная хирургия детского возраста. — 2015. — Т. 3. — Вып. 3. — С. 26–31. [Nikityuk IE, Klychkova IY. Computer plantography as a diagnostic method for congenital clubfoot in children. Pediatric traumatology, orthopaedics and reconstructive surgery. 2015;3(3):26-31. (In Russ.)]
- Кашуба В.А. Биомеханика осанки. — Киев: Олимпийская литература, 2003. — 279 с. [Kashuba VA. Biomekhanika osanki. Kiev: Olimpiiskaya literature; 2003. 279 p. (In Russ.)]
- Давыдов В.Ю. Проблемы внедрения соматотипирования в диагностику морфофункциональных состояний опорно-двигательного аппарата спортсменов // Мат. междунар. науч.-практ. конф. «Проблемы диагностики, укрепления и реабилитации опорно-двигательного аппарата у спортсменов». — Волгоград: ФГОУ ВПО «ВГАФК», 2008. — С. 45–46. [Davydov VYu. Problemy vnedreniya somatotipirovaniya v diagnostiku morfo-funktsional’nykh sostoyanii oporno-dvigatel’nogo apparata sportsmenov. (conference proceedings) Mat. mezhdunar. nauch.-prakt. konf. “Problemy diagnostiki, ukrepleniya i reabilitatsii oporno-dvigatel’nogo apparata u sportsmenov”. Volgograd: FGOU VPO “VGAFK”; 2008. P. 45-46. (In Russ.)]
- Murphy DF, Beynnon BD, Michelson JD, Vacek PM. Efficacy of plantar loading parameters during gait in terms of reliability, variability, effect of gender and relationship between contact area and plantar pressure. Foot ankle Int. 2005;26(2):171-179.
- Скворцов Д.В. Диагностика двигательной патологии инструментальными методами: анализ походки, стабилометрия. — М.: Т.М. Андреева, 2007. — 640 с. [Skvortsov DV. Diagnostika dvigatel’noi patologii instrumental’nymi metodami: analiz pokhodki, stabilometriya. Moscow: T.M. Andreeva; 2007. 640 p. (In Russ.)]
- Perry J. Gait analysis. Normal and pathological function. SLACK Incorporated; 1992. 524 p.
Дополнительные файлы

